Developing an AI System for Smart Traffic: From Vehicle Detection to Data Analytics Dashboard
Final Year Project 2024–2025
Champion · CPEG Best FYP Award 2024–25
Abstract
Hong Kong's dense road network needs timely, affordable traffic information. Sensor-based systems are accurate but need specialised equipment that is costly to install and maintain, which limits how widely they can be deployed; cameras analysed by deep learning models are a cheaper alternative that can do several jobs at once.
Developed in collaboration with K11 MUSEA in Tsim Sha Tsui, this project builds a computer vision traffic analytics system and a dashboard that turn camera video into traffic insights. An Edge Traffic Analyzer runs a YOLO11 detector fine-tuned on Hong Kong vehicle data together with the ByteTrack tracker, and per-zone task managers extract average speed, vehicle count, traffic flow rate, congestion level, vehicle type distribution, and illegal parking events. The analyzer sends these results asynchronously to a FastAPI server, which stores them in Redis for a Streamlit dashboard.
Tested end to end on pre-recorded footage, the pipeline processed 2560 × 1440 video at 30.82 frames per second with GPU support. Zones and tasks are set in a configuration file, so the system can be set up for other locations.
System Overview
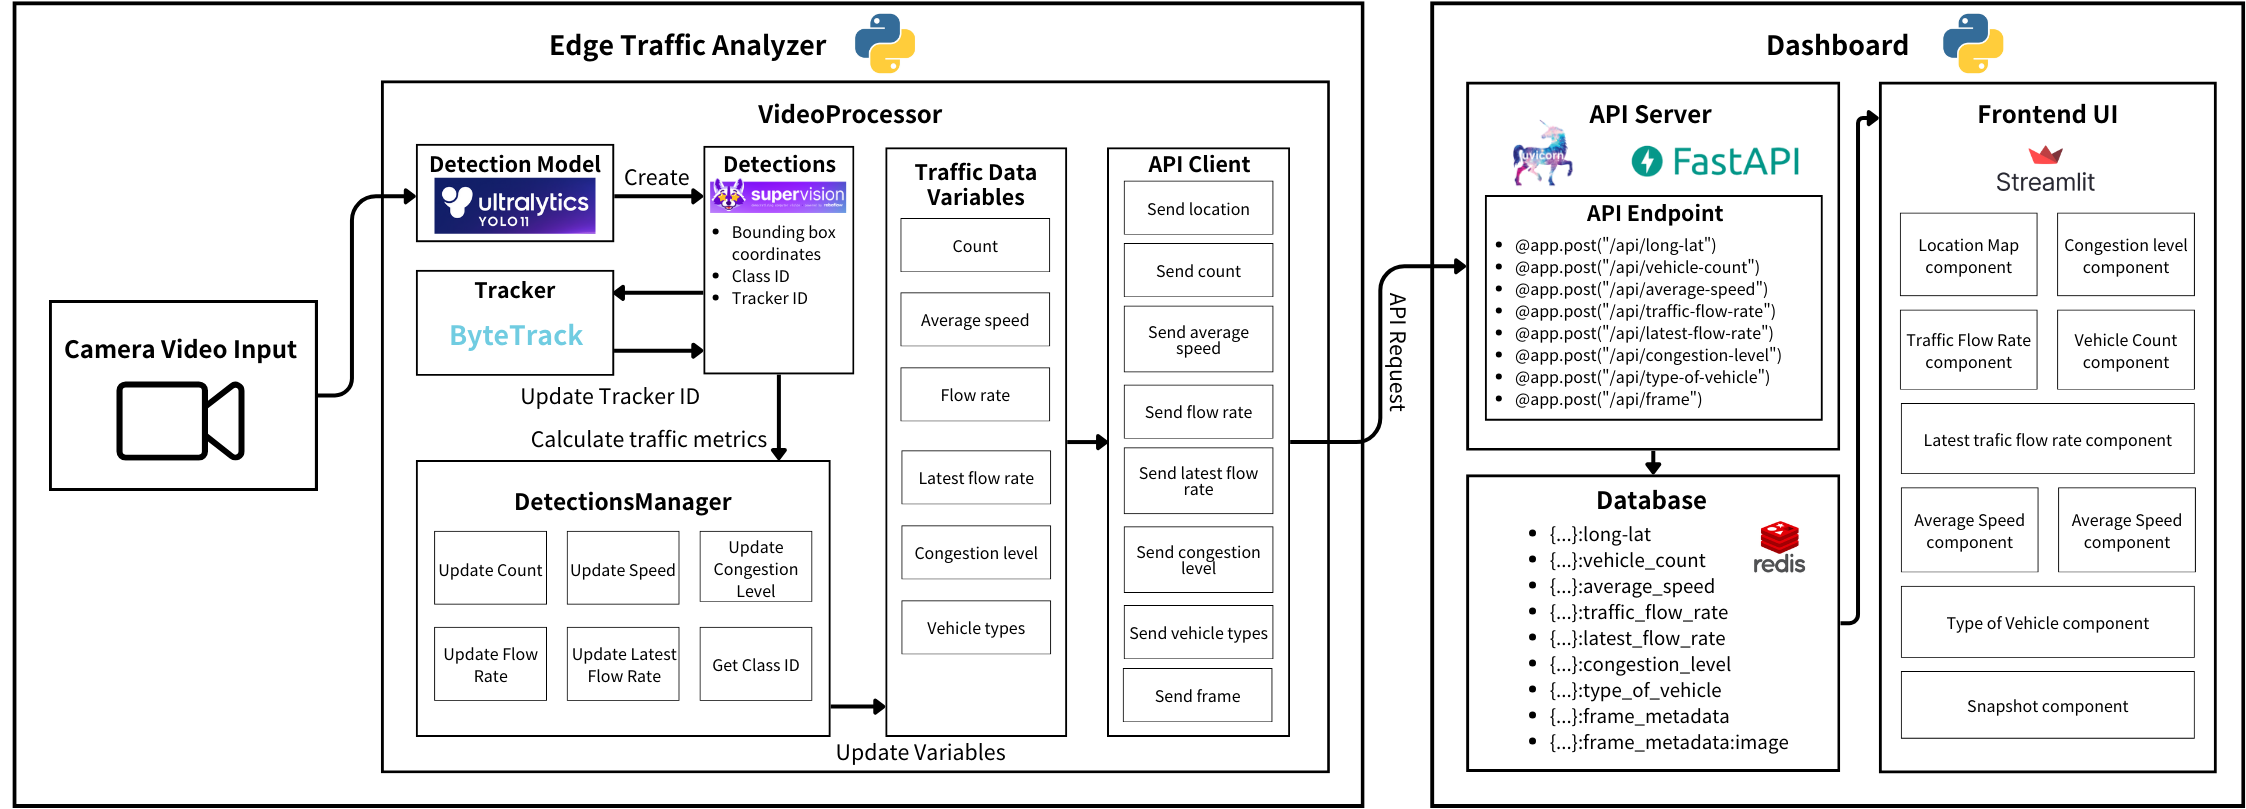
The system has two modules. The Edge Traffic Analyzer detects and tracks vehicles in camera video and extracts traffic data next to the camera, so only the extracted data and snapshots, not the video stream, travel to the server. The Dashboard receives that data through a FastAPI server, keeps it in a Redis in-memory database, and visualises it in a Streamlit web app. The analyzer sends each kind of data to its own API endpoint at its own interval: vehicle counts every second, average speed every 30 seconds, congestion level and vehicle types every 60 seconds, and illegal parking snapshots as soon as a violation is detected.
Edge Traffic Analyzer
Detection and tracking
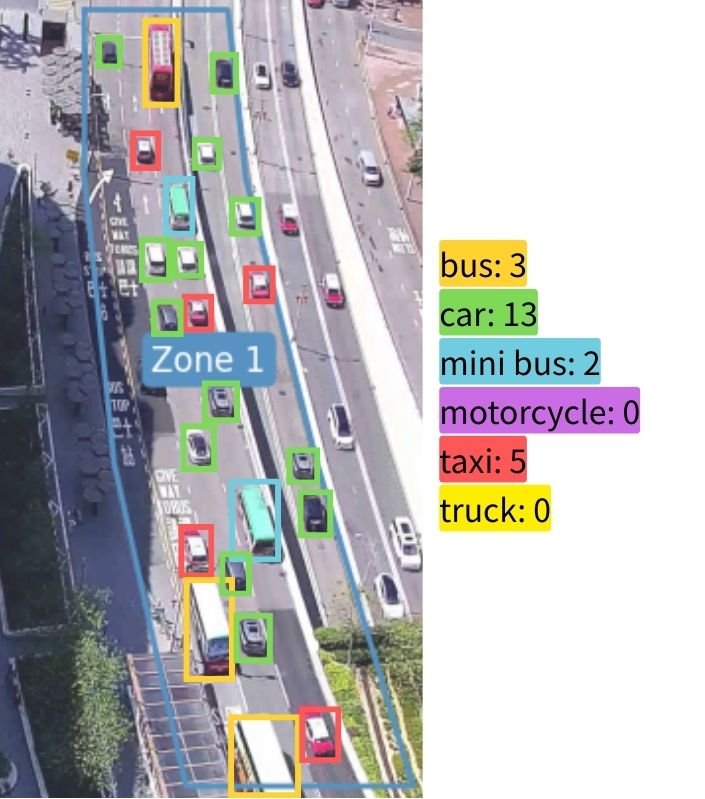
The detector is YOLO11, fine-tuned to recognise six vehicle classes common in Hong Kong: bus, car, minibus, motorcycle, taxi, and truck. Its training data combines public Hong Kong datasets from Roboflow Universe with frames we labelled ourselves in Label Studio from deployment-like camera angles, including the K11 MUSEA camera. ByteTrack then links detections across frames, giving every vehicle a stable ID so it is counted once.
Zones and task managers
A configuration file describes each camera location: its name, GPS coordinates, and a list of zones. A zone is a polygon in the image together with its real-world width and length, speed limit, vehicle capacity, and the tasks to run in it. Every task is a task manager with a shared interface, so traffic metrics and illegal parking detection can run side by side in different zones, and a new task can be added without touching the core pipeline.
Speed
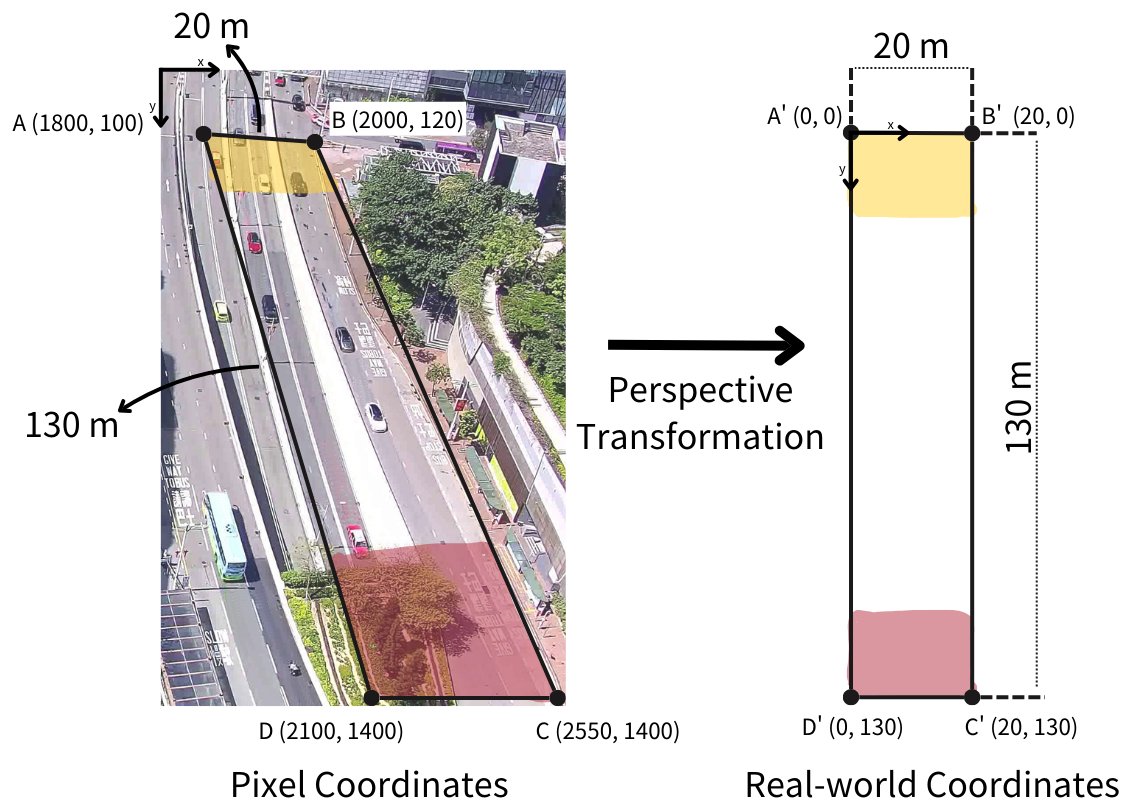
Pixel distances shrink with distance from the camera, so speeds are measured in real-world coordinates. A homography computed from each zone's four corners and its measured width and length maps every vehicle's bounding-box centre to metres; the displacement between consecutive frames, divided by the time between them, gives the vehicle's speed in km/h. The zone's average speed is the mean over the vehicles currently in it.
Count, flow rate, and vehicle types
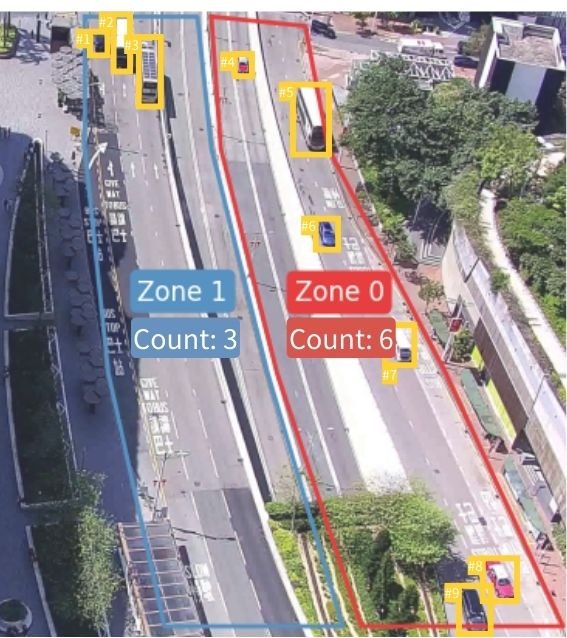
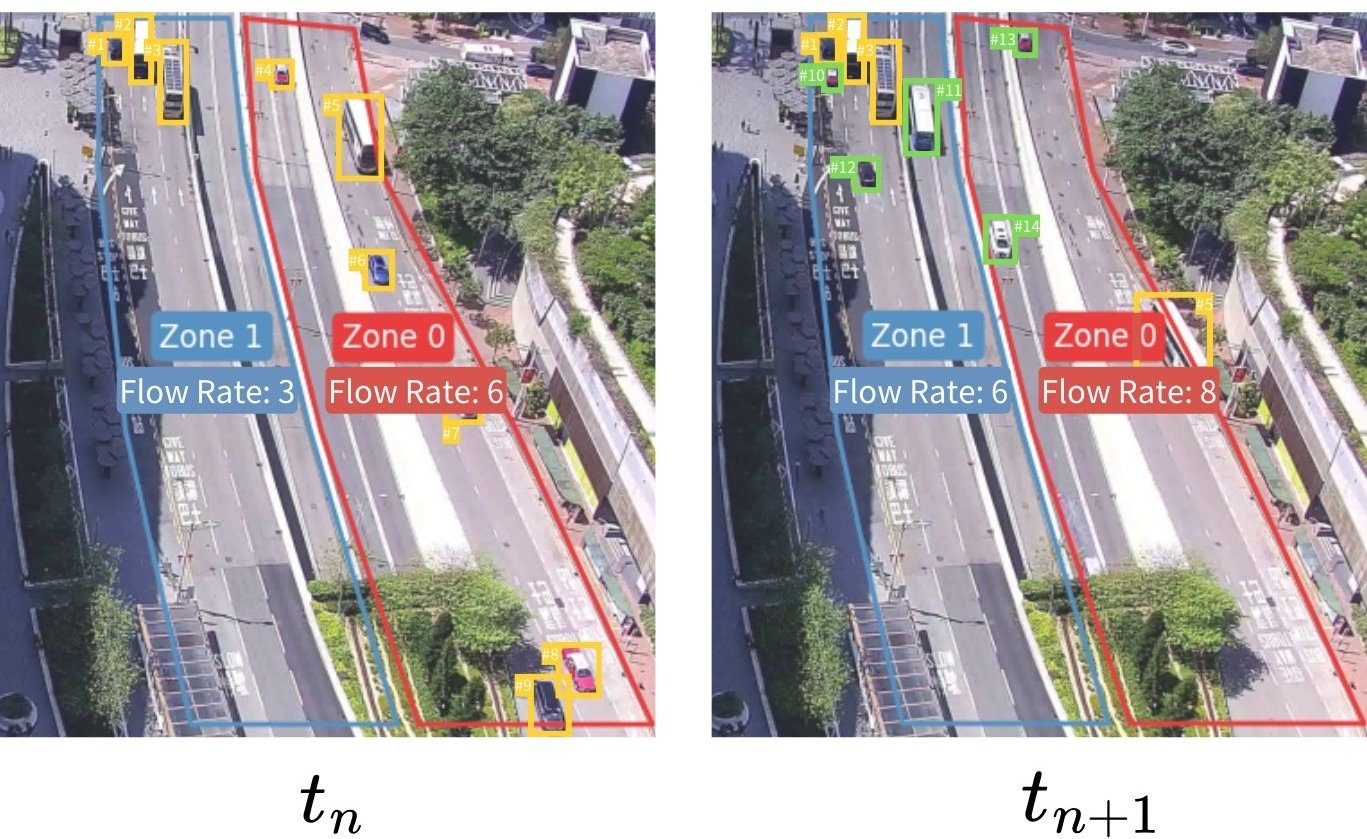
The vehicle count is the number of unique tracker IDs inside a zone in the current frame. The flow rate counts the new unique vehicles that enter a zone during an interval, typically one hour, and the vehicle type distribution is accumulated over the same kind of interval.
Congestion level
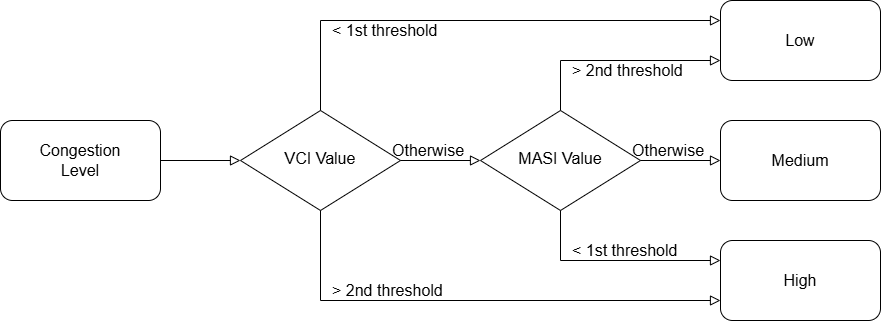
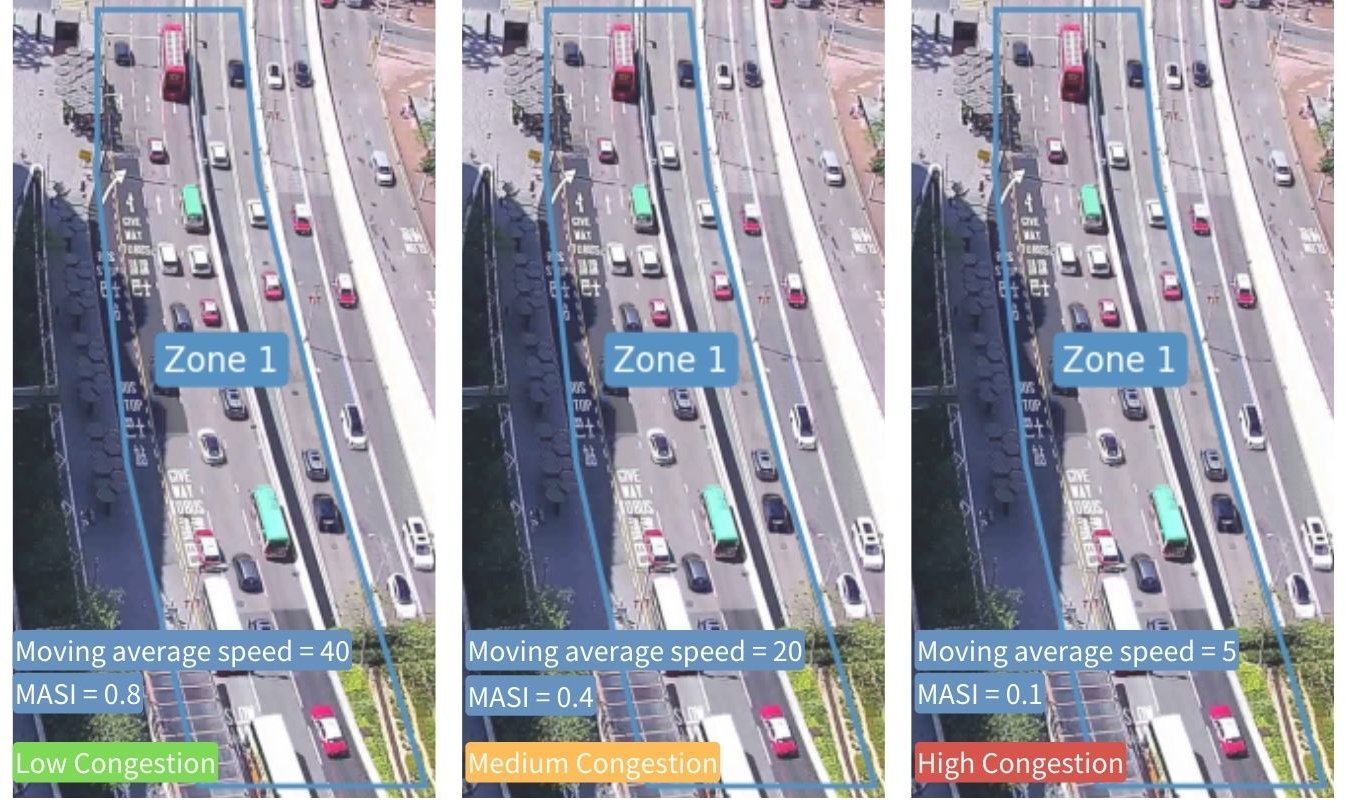
Congestion combines two indexes. The vehicle count index is the rolling average vehicle count divided by the zone's capacity, and the moving average speed index is the moving average speed divided by the speed limit. A nearly empty or nearly full zone is classified by the count index alone; in between, the speed index separates free-flowing from slow traffic.
Illegal parking
The parking task flags a vehicle whose speed stays below a threshold (for example 1 km/h) for longer than an idle time (for example 30 seconds). Each zone can limit detection to a time window and to selected vehicle types, as Hong Kong parking restrictions often do. A flagged vehicle produces an annotated snapshot that is sent to the dashboard for review.
Zone Setup Tool
To set up a new location, an administrator runs the zone setup tool on a reference image from the camera and clicks the corners of each zone: left-click adds a point, right-click undoes it, n confirms a zone, and q finishes. The tool writes the coordinates into the configuration file, so a new site needs no code changes.
Dashboard
The dashboard turns the analyzer's data into views for traffic administrators. It has three parts: a FastAPI server, run with Uvicorn, that receives the data; a Redis in-memory database that stores it; and a Streamlit web app that visualises it.
Receiving data
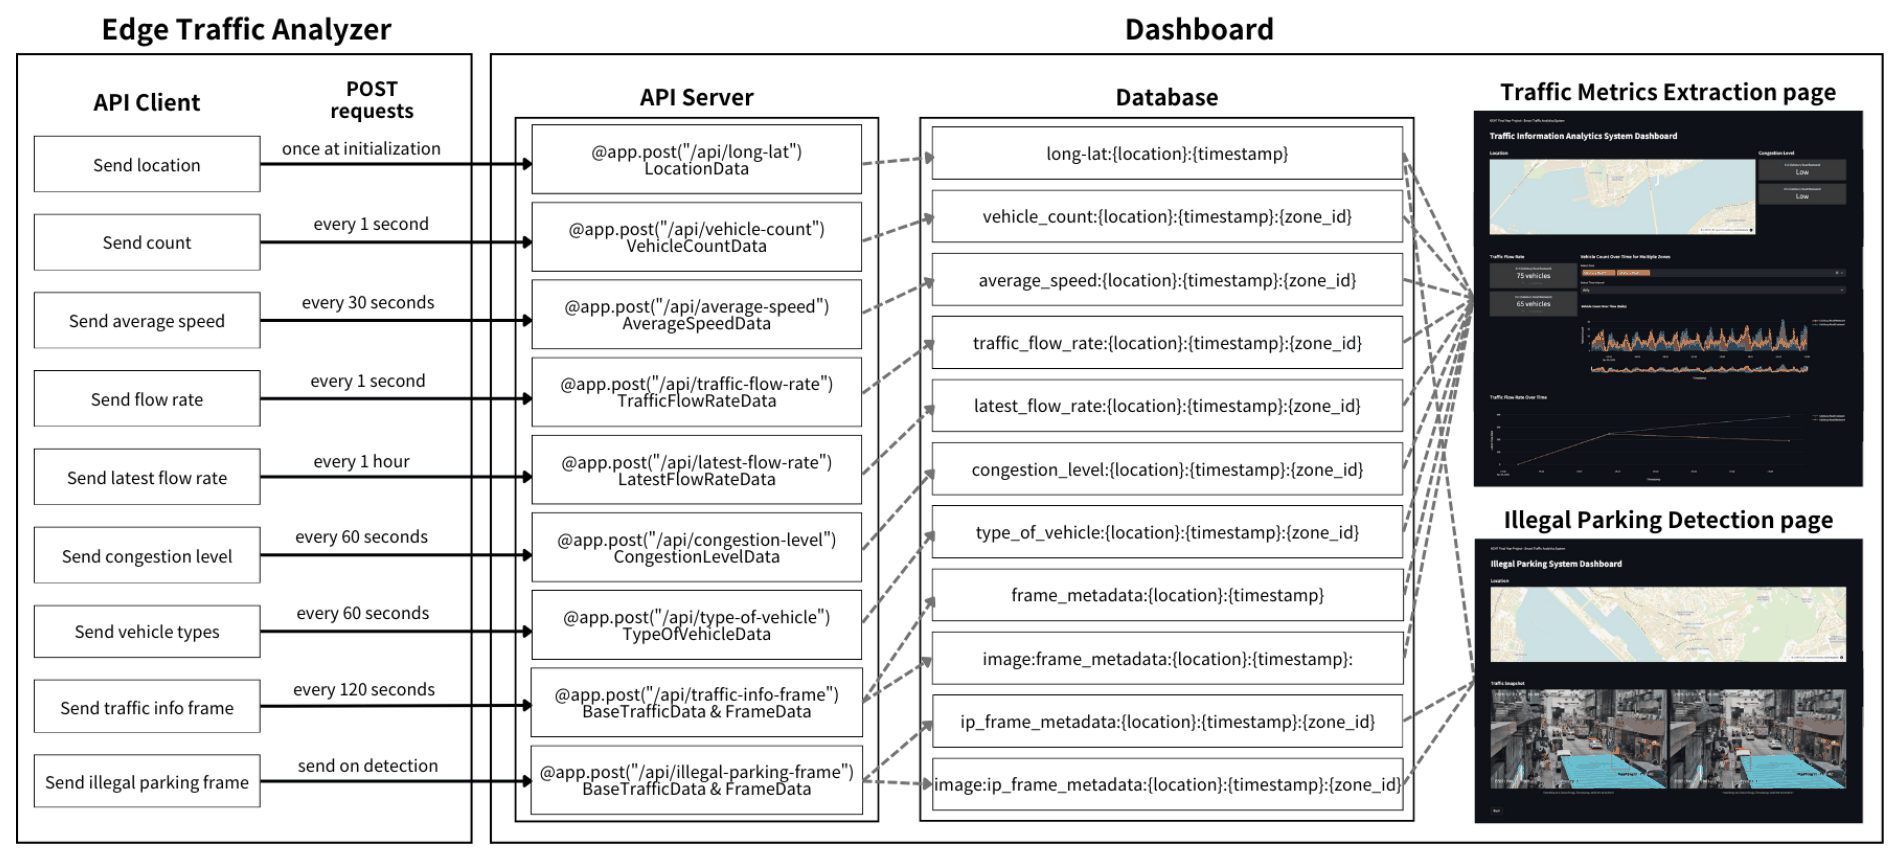
Because the metrics change at different rates, each has its own endpoint and its own sending interval: the location once at start-up, vehicle counts and flow rate every second, average speed every 30 seconds, congestion level and vehicle types every 60 seconds, the latest flow rate every hour, a traffic snapshot every 120 seconds, and an illegal parking snapshot as soon as a violation is detected. On the analyzer, an asynchronous worker sends the requests so that networking never blocks video processing.
Data model
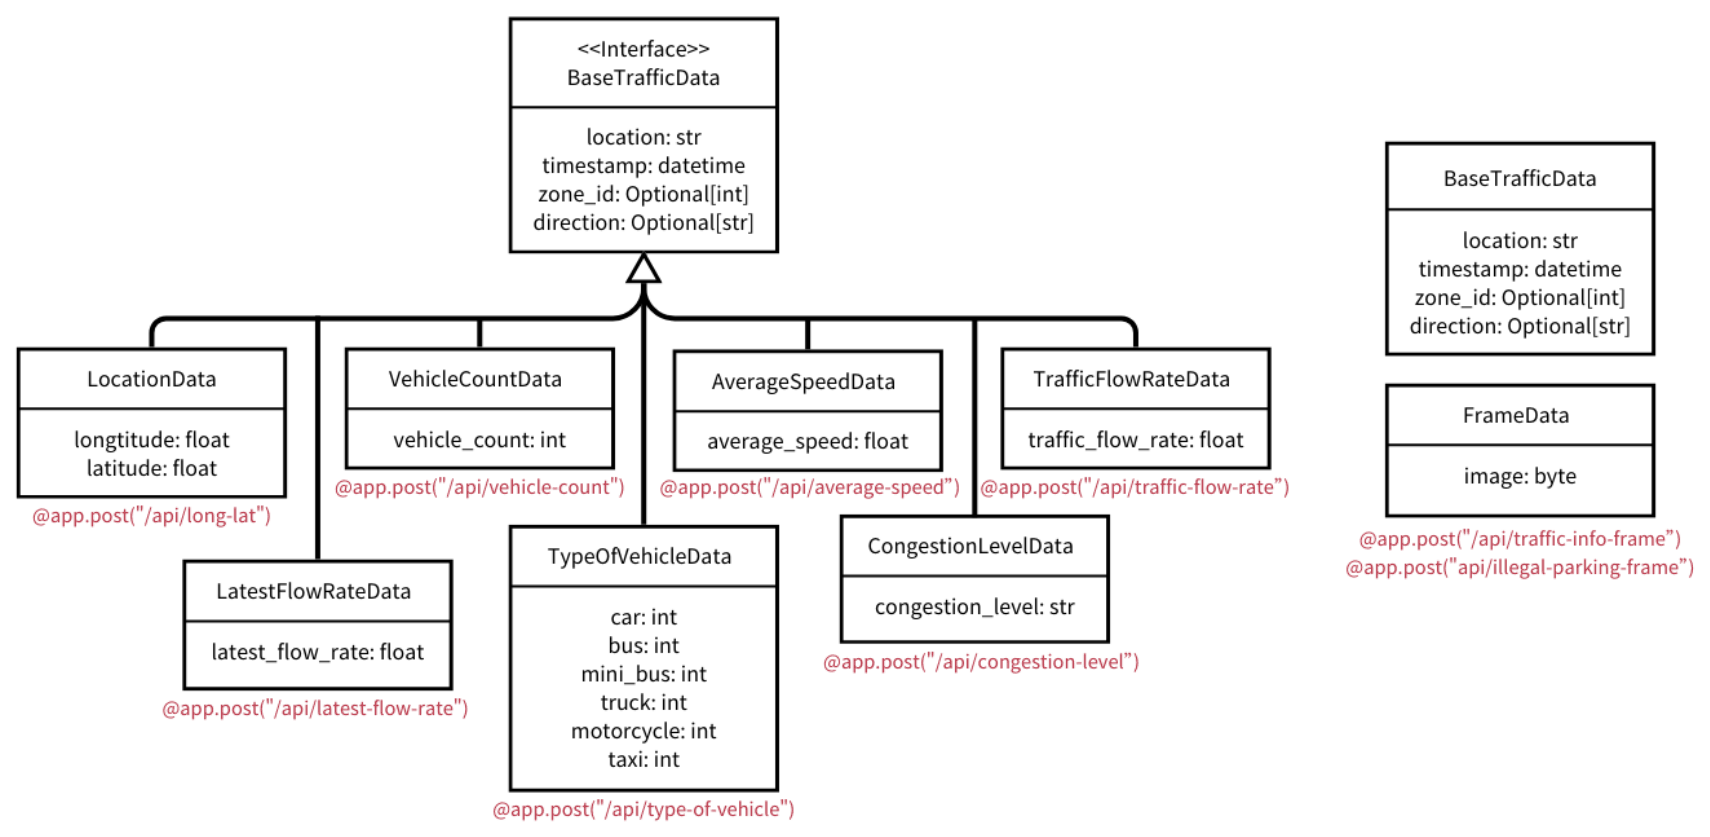
BaseTrafficData; snapshots arrive as raw image bytes in FrameData.Every request body is validated with Pydantic. The base class, BaseTrafficData, holds what all traffic data shares: the location (for example K11), a timestamp, and optionally a zone ID and the zone's direction of travel (for example Salisbury Road eastward). Seven subclasses each add one kind of measurement. LocationData adds longitude and latitude for the map, TypeOfVehicleData adds a count for each of the six vehicle classes, and the rest add a single value: vehicle count, average speed, flow rate, latest flow rate, or congestion level. Snapshots are sent as raw bytes rather than JSON, so a separate FrameData class receives the image, while its timestamp and location arrive as BaseTrafficData metadata.
Storage in Redis
Redis keeps the data in memory, which gives the low-latency reads and writes a live dashboard needs. Each record is written with a SET command under a key built from the data type, the location, the timestamp, and the zone ID where there is one, for example average_speed:{location}:{timestamp}:{zone_id}; the value is the metric as JSON. The location is sent once per site, so its key has no zone: long-lat:{location}:{timestamp}. Each snapshot uses two keys, one for its metadata and one, prefixed with image:, for the image bytes. A traffic snapshot covers every zone in the camera view, so its keys have no zone ID; illegal parking snapshots are taken per zone and include it, as in ip_frame_metadata:{location}:{timestamp}:{zone_id}.
Fetching data for the pages
To draw a chart, the dashboard asks Redis for every key that matches a wildcard pattern for one data type at one location. Keys put the data type first and the location second, so a single pattern query finds exactly those records. Each value is parsed from JSON, and the records are sorted by timestamp into a Pandas DataFrame for the time-series charts. For a snapshot, the dashboard first finds the latest metadata record, then builds the matching image: key from its location, timestamp and zone to fetch the picture.
Pages and navigation
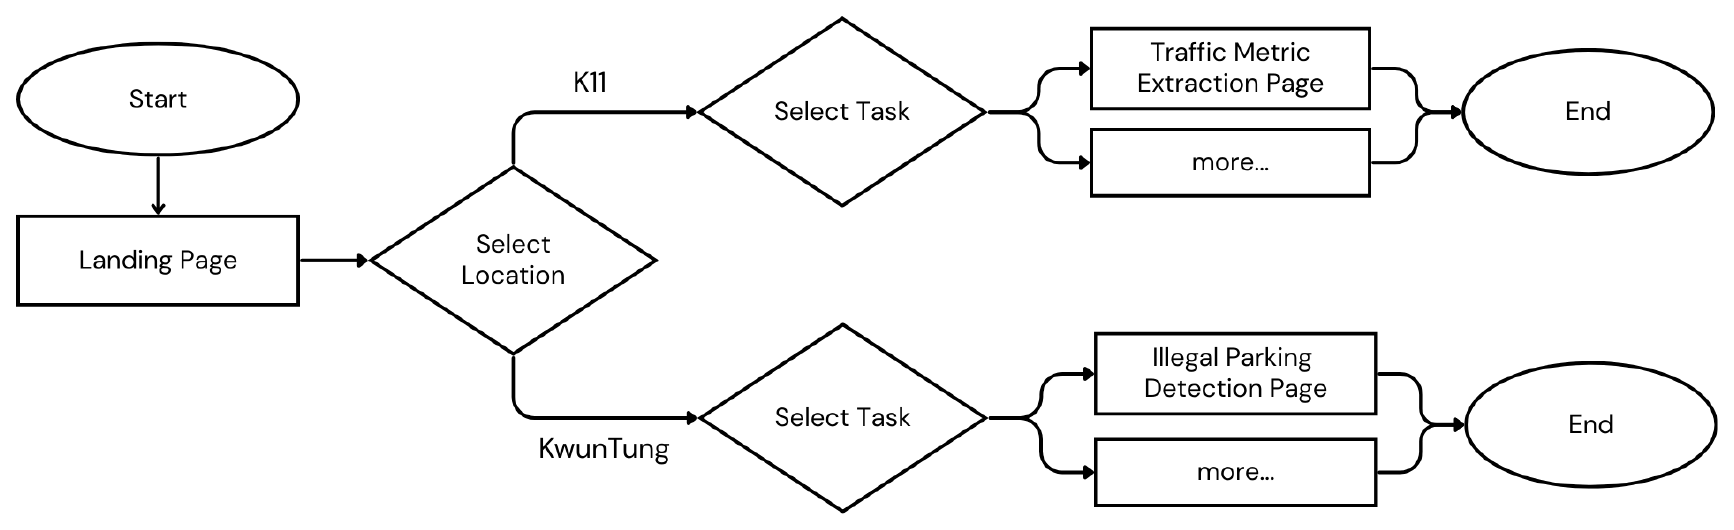
A JSON configuration maps each location to its tasks, for example K11 to traffic information and Kwun Tong to illegal parking. The landing page loads it with a cached function and offers two select boxes, one for the location and one for the tasks available there. The choices are kept in Streamlit's session state (selected_location and selected_task); Go opens the matching task page filtered to that location, and Back returns to the selection. A new site or task needs a configuration entry and, for a new task, a new page, but no change to the app's core logic.
Visualisations
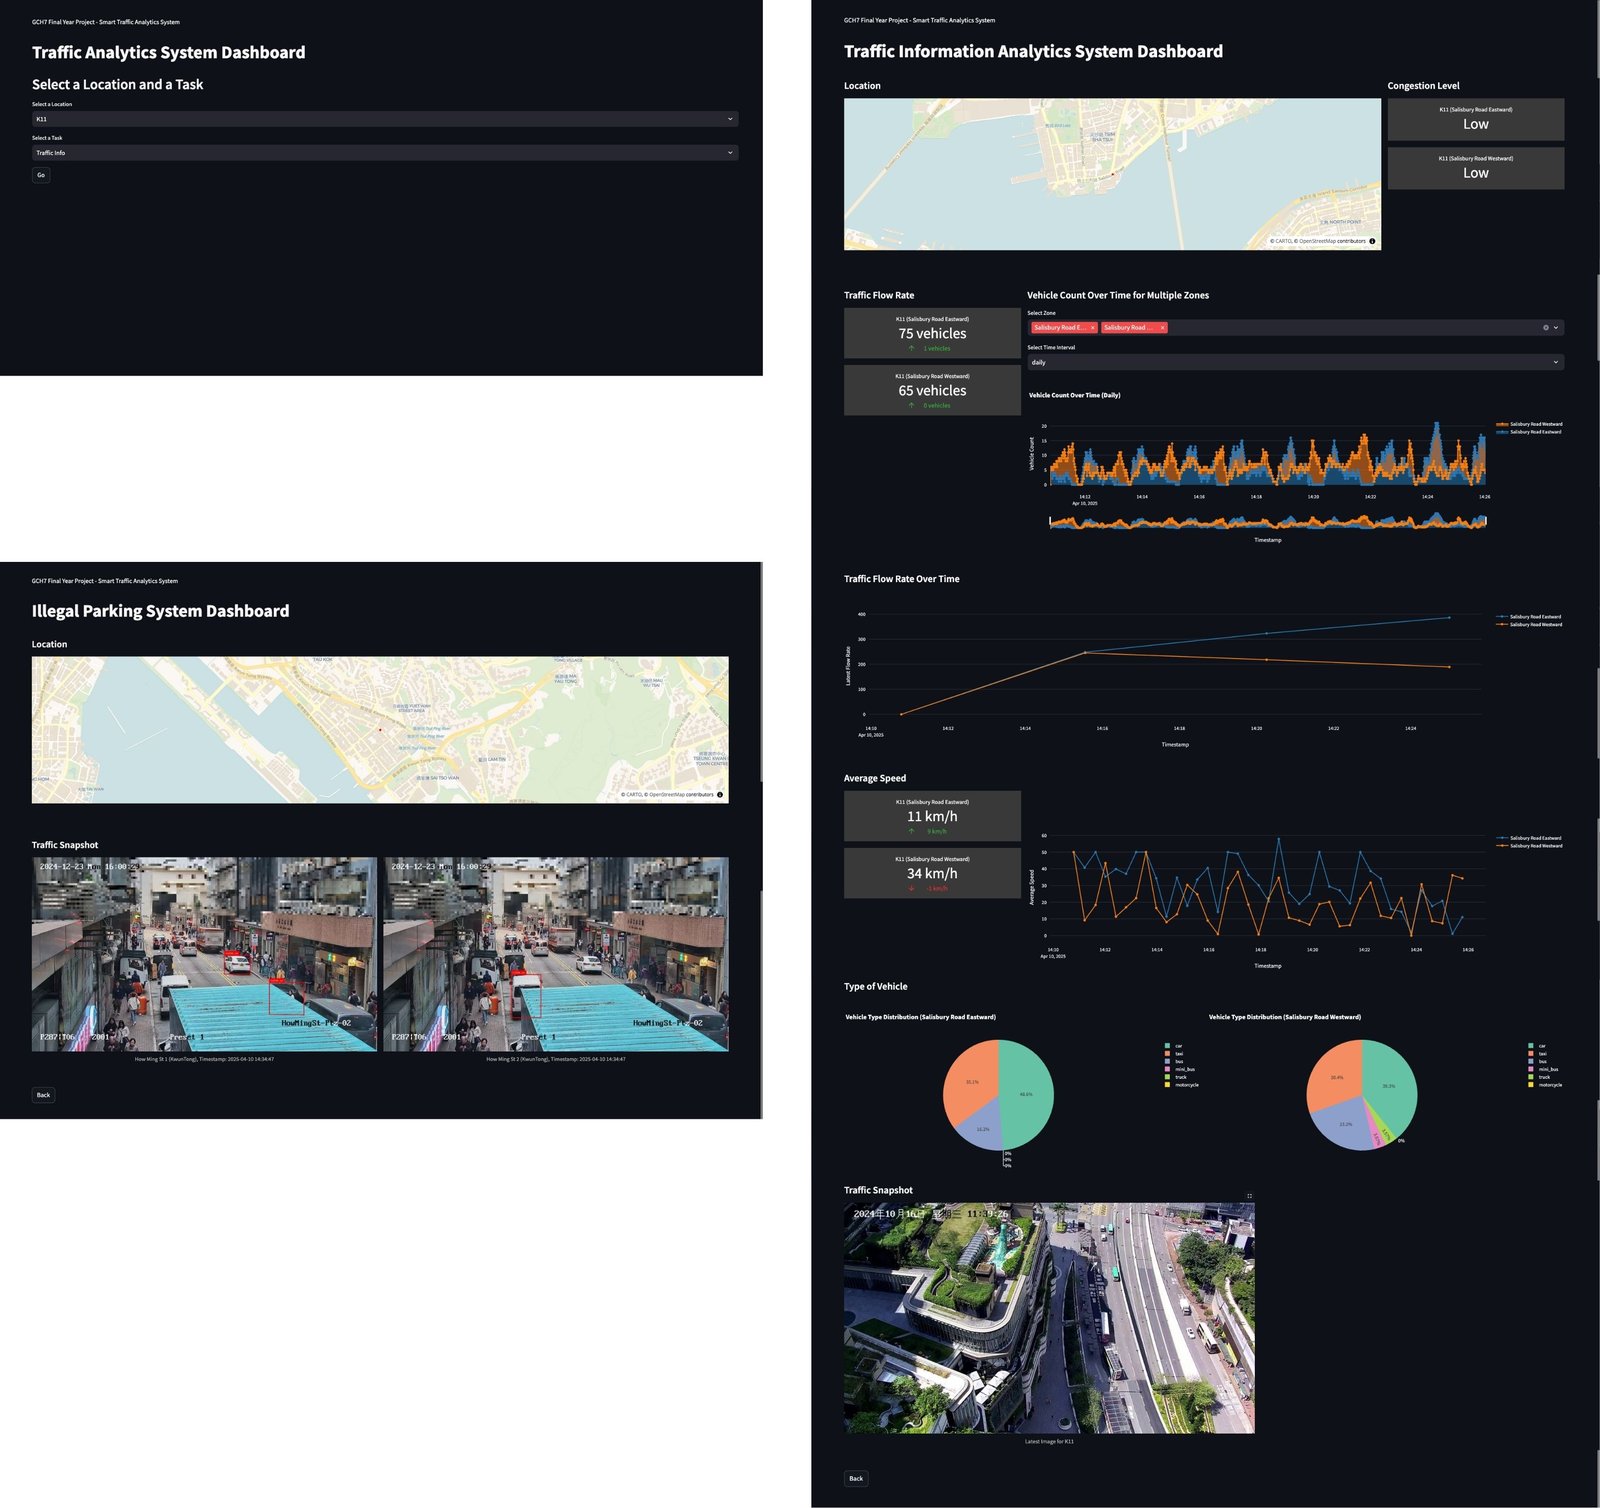
The pages combine Streamlit components with Plotly Express charts and refresh every second.
- Map: the camera location on an OpenStreetMap view, on both pages.
- Congestion level: the current level for each direction, using Streamlit's built-in components.
- Flow rate: a live number for each direction.
- Vehicle count: a line chart over time, with a multi-select for zones and a choice of daily, weekly, monthly, or yearly granularity.
- Latest flow rate: a line chart of the hourly flow.
- Average speed: the current speed as a number, plus a line chart of its history.
- Vehicle types: a pie chart of the class mix for each direction.
- Snapshots: the latest traffic snapshot on the traffic page, and the newest violation in each zone on the illegal parking page.
Results
Vehicle detection
The detector was fine-tuned on 6,850 labelled vehicle instances (5,496 for training and 1,354 for validation), including 201 self-labelled samples. On the validation set it reaches 52.7% mAP@0.5 overall, which is moderate accuracy. Large vehicles are found most reliably: buses reach 72.4% mAP@0.5 and the highest recall, 80.5%. Motorcycles are the hardest class, at 24.3% mAP@0.5, because they are small and often occluded or blurred.
Table 1. Fine-tuned YOLO11 on the validation set; precision, recall, and mAP in %.
| Class | Images | Instances | Precision | Recall | mAP@0.5 | mAP@0.5:0.95 |
|---|---|---|---|---|---|---|
| All | 486 | 1354 | 53.5 | 61.2 | 52.7 | 35.5 |
| Bus | 52 | 82 | 57.4 | 80.5 | 72.4 | 44.6 |
| Car | 135 | 679 | 55.2 | 63.0 | 61.9 | 40.9 |
| Minibus | 60 | 117 | 55.3 | 54.7 | 50.2 | 38.1 |
| Motorcycle | 55 | 113 | 40.0 | 47.7 | 24.3 | 14.1 |
| Taxi | 95 | 172 | 57.4 | 51.7 | 49.6 | 32.4 |
| Truck | 96 | 191 | 55.5 | 69.6 | 57.9 | 42.9 |
End-to-end throughput
The integration test ran the whole pipeline, from video through detection, tracking, metric extraction, API requests and Redis to the dashboard, on 1,500 frames of 2560 × 1440 pre-recorded video on our development hardware. With GPU support it averaged 30.82 frames per second, meeting the 30 fps real-time target; on the CPU alone it was about four times slower.
Table 2. Processing time for 1,500 frames of 2560 × 1440 video.
| Device | Time (s) | Average FPS |
|---|---|---|
| CPU | 199.66 | 7.51 |
| GPU (CUDA) | 48.66 | 30.82 |
Testing
Unit tests cover 91% of the Edge Traffic Analyzer's statements and 97% of the dashboard and API code (Table 3). The API module is 99% covered, and the pages, chart plotting, and data fetching are fully or almost fully covered; app.py, which holds the Streamlit layout, is lower at 65% and was tested by hand instead. Every API endpoint was also exercised through FastAPI's interactive documentation, returning status 200 for valid payloads and 422 with validation messages for invalid ones. In manual UI tests, testers selected locations and tasks, moved between pages with Go and Back, and checked the maps, charts, and metrics against the data stored in Redis.
Table 3. Unit-test coverage of the dashboard and API code.
| Module | Statements | Coverage |
|---|---|---|
api.py | 124 | 99% |
app.py | 34 | 65% |
pages/illegal_parking.py | 18 | 100% |
pages/traffic_info.py | 50 | 100% |
src/chart_plot.py | 140 | 100% |
src/info_fetch.py | 74 | 97% |
| Total | 440 | 97% |
Limitations and Future Work
- Pre-recorded video, not a live deployment. Our edge device lacked a capable GPU, so the system was developed and tested on recorded footage from the K11 MUSEA camera and from Kwun Tong. Cameras for illegal parking detection had not been installed. Throughput on a GPU-equipped edge device may differ from the figures above.
- Edge workload. Real-time processing needs a GPU. Smaller detectors lose accuracy, and skipping frames breaks ByteTrack's tracking, so lowering the workload enough for low-powered edge devices remains future work.
- Illegal parking robustness. When an idle vehicle is occluded and tracking is lost, its idle timer restarts, so some violations are missed. The rule also cannot yet tell a parked car from one waiting at a red light; traffic signal data and occlusion-tolerant tracking would help.
- Small vehicles. Motorcycles and distant vehicles are often missed. More labelled data for weak classes, hard negative mining, and augmentation for lighting and occlusion could improve detection.
- Storage. Redis is the only database. Long-term history would call for a disk-based database behind Redis or a high-availability Redis setup.
Acknowledgments
We thank our advisor, Prof. Gary Shueng-Han Chan, and our mentor, Aaron Qingchun Yang, for their guidance. The project builds on Ultralytics YOLO11, ByteTrack, Supervision, FastAPI, Redis, Streamlit, and publicly available vehicle datasets alongside footage we labelled ourselves.